Whether you are writing your business plan or already has the production process, you need to be familiar with the costs that arise from that process. One of these costs is the average variable cost, and you can calculate it straightforwardly with the help of our calculator for calculating the average variable costs.
But why is this information important to us for our business at all?
Well, for a simple reason. A minor production process also means a lower average variable cost and vice versa. If we increase production, we must know that our expenses will also increase. In this way, we can calculate the extent to which we can increase output without knowing that we have enough money to cover the costs incurred in the process.
Also, this calculation can help us stop the production process promptly or reduce costs in a certain period to avoid expenses that the company cannot bear.
What is the average variable cost?
Average variable costs are costs per unit of output. They appear only with the beginning of production and disappear with the cessation of production. With each change in production volume, the total variable costs also change, while the unit variable costs remain the same.
How to calculate the average variable cost?
To calculate the average variable cost, you must first find out what your total variable cost is. The total variable costs directly depend on the number of goods produced in a given period. For example, the hourly cost of your employee in the production process or the cost of electricity required for each production facility is included in the total variable costs. To get the amount of the total variable costs, add up all the marginal costs for each of the production units.
The average variable cost formula
Average variable costs are equal to the ratio of total variable costs to production volume. The formula used to calculate the average variable cost is:
AVC = \frac{VC}{Q}where is
VC – total variable costs
Q – the amount of production in a given period.
And here is what it looks like in the example:
Let’s say we are engaged in the production of socks. Our production factory employs ten employees, and we know their schedule. They work on machines that use electricity exclusively. At the end of the production process, they pack everything neatly in ready-made packaging, then in large cardboard boxes and forward it to the transport center.
After we add up all the costs we have every month for this production facility, we get the amount of $ 20,000. Annually, that amount is $ 240,000. These are our total variable costs (VC).
In the production process, we produce 10,000 pairs of socks per month. In a year, we will reach the number of 120,000 pairs of socks. It is our annual production volume.
With the help of our calculator for calculating the average variable costs, you can easily get the information that the average variable cost for this example is:
AVC = \frac{240000}{120000}
AVC = 2
If the product’s price on the market is higher than the AVC of that product, we can say that the manufacturer successfully covers all variable costs and part of fixed costs. It is a sign that you can continue production at the planned pace. If the opposite scenario occurs, consider temporarily suspending planned production until the market situation improves.
The average variable cost curve
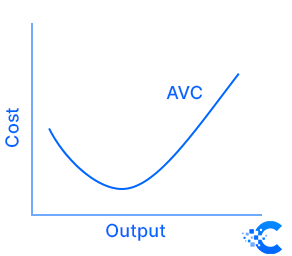
A diagram and a curve showing the growth or decrease of the average variable costs of a production plant can be used to represent the average variable costs graphically.
The x-axis shows the number of goods produced, and the y-axis shows the total variable costs.
The most common result should be a U-shaped cost curve. At the beginning of production, the angle decreases, but as the end of the process nears, it starts to grow. The reason is simple. At the beginning of the production process, the costs increase because it is necessary to activate the entire production factory to get the product. As the end of production approaches, specific functions disappear, and costs decrease.

Finally, it is good to know that AVC is directly correlated with marginal costs. Marginal costs represent the change in total cost that occurs with an additional unit of product. You can use this relationship between marginal cost and AVC to predict the relationship between marginal cost and average variable cost.
If the marginal cost curve is under the average variable cost curve, you can say that the average variable cost should decrease. On the other hand, the average variable cost will increase.
If the average variable cost is minimum, the marginal cost will be the same as the average variable cost.
